Good question. The BTMA Stock Analyzer is the only tool that combines a speedy stock screener, deep fundamental analysis, quantitative and qualitative analysis, and a stock picker all in one.
I believe that my product’s greatest strength is the huge amount of time it will save you.
When other investors are hesitating by spending weeks grazing over endless data and individually comparing stocks, you will be able to analyze the entire S&P 500 and the thousands of US traded stocks with the click of a button. And the Analyzer will directly tell you a handful of the best stocks to buy.
Best of all, your investment decisions will be 100% based on fact; you will be confident and ready to take action while other investors are still waiting with an uncertainty of which stock to buy.
In the section below, we will look at some results....
CURRENT RESULTS
Time-Weighted Returns, Period: 2013 - Present
This is the time-weighted return result of a real account using the BTMA stock-picking method over the course of multiple years. (click chart to enlarge it)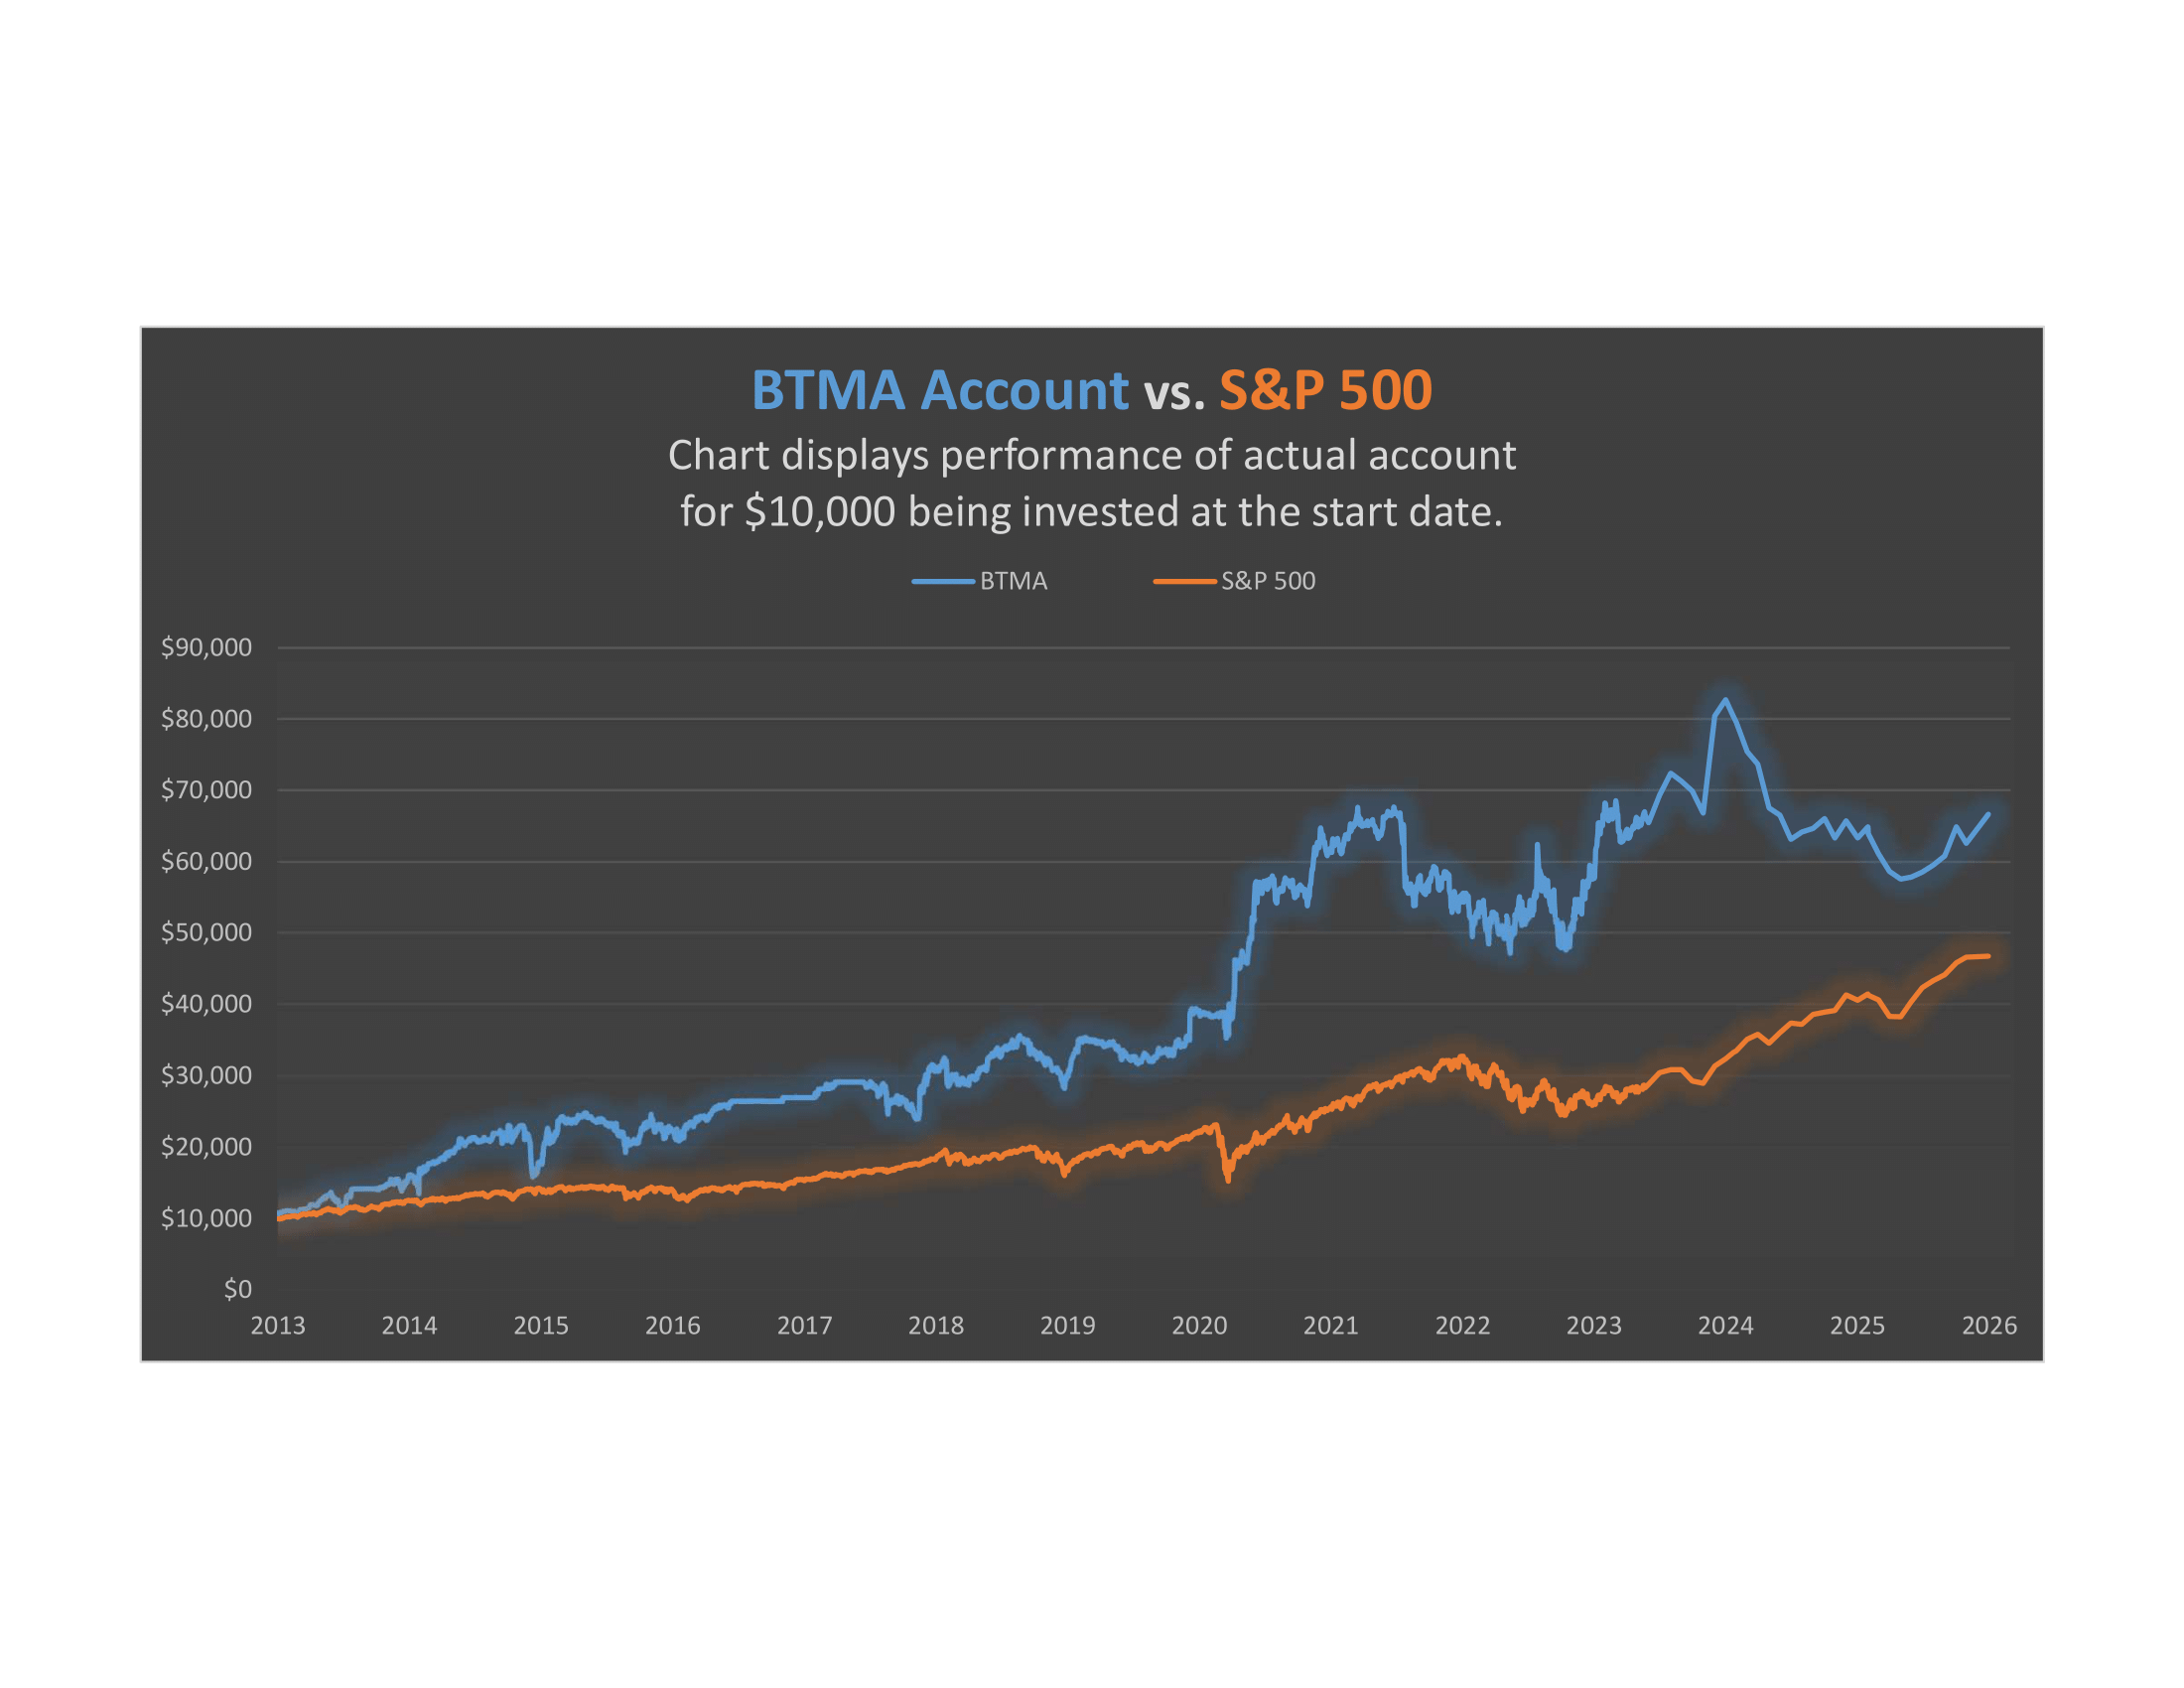
Absolute Return (from January 2013 till January 2026)
BTMA S&P 500
545.2% 368.1%